
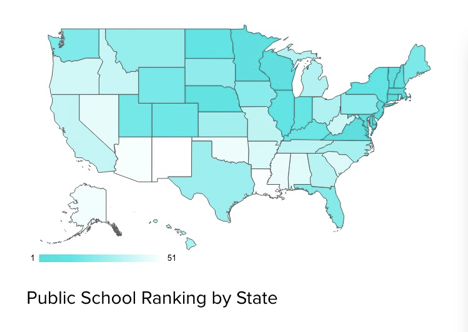
美国教育水平整体上非常高,这一点毋庸置疑。华人朋友们了解比较多的是高等教育的水平。对于美国高中,美国初中,特别是美国小学的教育水平了解的相对很少。然而各个州甚至城市之间的资源分布及其不均,水平也是参差不齐。 特别是公立的中小学首当地经济水平,政治环境影响非常大。水平差异更是天壤之别。Wallethub从教育质量和安全两个方面,对各个州的中学,小学公立教育进行了洗底大排名。那么,美国哪些州教育水平最高,那些州教育水平比较低呢?整体来看,教育水平高的州大都位于经济发达的东北部,马萨诸塞州在各大榜单均占据第一名位置,这里也不例外。闲话少叙,上排名表,大家自己浏览吧。祝大家望子成龙的心,得以如愿。
| Overall Rank (1 = Best) | State | Total Score | Quality’ Rank | Safety’ Rank | |
| 1 | Massachusetts | 71.73 | 1 | 1 | High school graduation rate: 87.5% (13th highest) Public school spending: $14,569 per pupil (11th highest) 8th grade NAEP proficiency: 50.8% (math) 45.7% (reading) Adults with at least a bachelor’s degree: 42.7% (the highest) Adults 25-64 with incomes at or above national median: 62.6% (the highest) |
| 2 | Connecticut | 66.25 | 2 | 19 | High school graduation rate: 87.4% (15th highest) Public school spending: $17,283 per pupil (5th highest) 8th grade NAEP proficiency: 36.1% (math) 43.3% (reading) Adults with at least a bachelor’s degree: 38.6% (4th highest) Adults 25-64 with incomes at or above national median: 61.5% (3rd highest) |
| 3 | New Jersey | 65.64 | 3 | 15 | High school graduation rate: 90.1% (2nd highest) Public school spending: $16,337 per pupil (6th highest) 8th grade NAEP proficiency: 46.2% (math) 40.6% (reading) Adults with at least a bachelor’s degree: 38.6% (4th highest) Adults 25-64 with incomes at or above national median: 60.0% (4th highest) |
| 4 | Virginia | 63.75 | 4 | 3 | High school graduation rate: 86.7% (20th highest) Public school spending: $10,358 per pupil (15th lowest) 8th grade NAEP proficiency: 37.6% (math) 35.9% (reading) Adults with at least a bachelor’s degree: 38.1% (6th highest) Adults 25-64 with incomes at or above national median: 57.0% (9th highest) |
| 5 | Vermont | 61.64 | 8 | 4 | High school graduation rate: 87.7% (11th highest) Public school spending: $20,795 per pupil (the highest) 8th grade NAEP proficiency: 42.1% (math) 43.8% (reading) Adults with at least a bachelor’s degree: 36.4% (8th highest) Adults 25-64 with incomes at or above national median: 53.4% (17th highest) |
| 6 | New Hampshire | 61.27 | 7 | 6 | High school graduation rate: 88.2% (9th highest) Public school spending: $15,719 per pupil (8th highest) 8th grade NAEP proficiency: 46.3% (math) 45.0% (reading) Adults with at least a bachelor’s degree: 36.6% (7th highest) Adults 25-64 with incomes at or above national median: 57.4% (7th highest) |
| 7 | Minnesota | 59.89 | 6 | 22 | High school graduation rate: 82.2% (16th lowest) Public school spending: $12,692 per pupil (22nd highest) 8th grade NAEP proficiency: 47.8% (math) 39.7% (reading) Adults with at least a bachelor’s degree: 34.8% (11th highest) Adults 25-64 with incomes at or above national median: 58.1% (6th highest) |
| 8 | Wisconsin | 59.66 | 5 | 24 | High school graduation rate: 88.2% (9th highest) Public school spending: $12,442 per pupil (24th highest) 8th grade NAEP proficiency: 40.8% (math) 39.0% (reading) Adults with at least a bachelor’s degree: 29.5% (23rd lowest) Adults 25-64 with incomes at or above national median: 53.0% (20th highest) |
| 9 | Delaware | 59.65 | 15 | 2 | High school graduation rate: 85.5% (25th highest) Public school spending: $14,224 per pupil (13th highest) 8th grade NAEP proficiency: 29.5% (math) 31.1% (reading) Adults with at least a bachelor’s degree: 31.0% (20th highest) Adults 25-64 with incomes at or above national median: 53.6% (16th highest) |
| 10 | Maryland | 58.51 | 11 | 9 | High school graduation rate: 87.6% (12th highest) Public school spending: $13,075 per pupil (19th highest) 8th grade NAEP proficiency: 34.7% (math) 37.4% (reading) Adults with at least a bachelor’s degree: 39.3% (3rd highest) Adults 25-64 with incomes at or above national median: 61.6% (2nd highest) |
| 11 | Nebraska | 58.42 | 12 | 8 | High school graduation rate: 89.3% (4th highest) Public school spending: $14,028 per pupil (14th highest) 8th grade NAEP proficiency: 37.7% (math) 37.8% (reading) Adults with at least a bachelor’s degree: 31.4% (19th highest) Adults 25-64 with incomes at or above national median: 51.6% (23rd highest) |
| 12 | New York | 57.03 | 16 | 10 | High school graduation rate: 80.4% (13th lowest) Public school spending: $18,665 per pupil (3rd highest) 8th grade NAEP proficiency: 30.9% (math) 32.8% (reading) Adults with at least a bachelor’s degree: 35.7% (9th highest) Adults 25-64 with incomes at or above national median: 55.0% (13th highest) |
| 13 | Illinois | 57.03 | 10 | 28 | High school graduation rate: 85.5% (25th highest) Public school spending: $13,403 per pupil (17th highest) 8th grade NAEP proficiency: 32.2% (math) 35.1% (reading) Adults with at least a bachelor’s degree: 34.0% (13th highest) Adults 25-64 with incomes at or above national median: 53.7% (15th highest) |
| 14 | North Dakota | 56.76 | 9 | 34 | High school graduation rate: 87.5% (13th highest) Public school spending: $14,372 per pupil (12th highest) 8th grade NAEP proficiency: 39.2% (math) 33.7% (reading) Adults with at least a bachelor’s degree: 29.6% (25th lowest) Adults 25-64 with incomes at or above national median: 57.2% (8th highest) |
| 15 | Indiana | 55.16 | 23 | 12 | High school graduation rate: 86.8% (19th highest) Public school spending: $11,342 per pupil (21st lowest) 8th grade NAEP proficiency: 38.7% (math) 37.1% (reading) Adults with at least a bachelor’s degree: 25.6% (9th lowest) Adults 25-64 with incomes at or above national median: 48.5% (18th lowest) |
| 16 | Kentucky | 54.73 | 14 | 33 | High school graduation rate: 88.6% (7th highest) Public school spending: $10,945 per pupil (18th lowest) 8th grade NAEP proficiency: 27.7% (math) 36.1% (reading) Adults with at least a bachelor’s degree: 23.4% (5th lowest) Adults 25-64 with incomes at or above national median: 47.4% (15th lowest) |
| 17 | Colorado | 54.71 | 17 | 27 | High school graduation rate: 78.9% (6th lowest) Public school spending: $9,733 per pupil (10th lowest) 8th grade NAEP proficiency: 36.9% (math) 38.2% (reading) Adults with at least a bachelor’s degree: 39.9% (2nd highest) Adults 25-64 with incomes at or above national median: 56.0% (12th highest) |
| 18 | Utah | 54.71 | 20 | 18 | High school graduation rate: 85.2% (24th lowest) Public school spending: $7,207 per pupil (the lowest) 8th grade NAEP proficiency: 37.9% (math) 38.0% (reading) Adults with at least a bachelor’s degree: 32.6% (17th highest) Adults 25-64 with incomes at or above national median: 50.9% (25th highest) |
| 19 | Wyoming | 54.45 | 18 | 29 | High school graduation rate: 80.0% (12th lowest) Public school spending: $17,700 per pupil (4th highest) 8th grade NAEP proficiency: 35.3% (math) 36.0% (reading) Adults with at least a bachelor’s degree: 27.1% (11th lowest) Adults 25-64 with incomes at or above national median: 51.7% (21st highest) |
| 20 | Maine | 54.23 | 24 | 14 | High school graduation rate: 87.0% (17th highest) Public school spending: $15,912 per pupil (7th highest) 8th grade NAEP proficiency: 35.4% (math) 35.6% (reading) Adults with at least a bachelor’s degree: 30.1% (25th highest) Adults 25-64 with incomes at or above national median: 49.1% (21st lowest) |
| 21 | Washington | 53.99 | 26 | 5 | High school graduation rate: 79.7% (11th lowest) Public school spending: $10,395 per pupil (16th lowest) 8th grade NAEP proficiency: 39.3% (math) 37.4% (reading) Adults with at least a bachelor’s degree: 35.1% (10th highest) Adults 25-64 with incomes at or above national median: 56.9% (10th highest) |
| 22 | Florida | 53.71 | 19 | 35 | High school graduation rate: 80.7% (14th lowest) Public school spending: $9,737 per pupil (11th lowest) 8th grade NAEP proficiency: 26.1% (math) 30.3% (reading) Adults with at least a bachelor’s degree: 28.6% (19th lowest) Adults 25-64 with incomes at or above national median: 42.9% (3rd lowest) |
| 23 | Iowa | 53.70 | 25 | 16 | High school graduation rate: 91.3% (the highest) Public school spending: $13,102 per pupil (18th highest) 8th grade NAEP proficiency: 37.3% (math) 35.6% (reading) Adults with at least a bachelor’s degree: 28.4% (17th lowest) Adults 25-64 with incomes at or above national median: 53.2% (18th highest) |
| 24 | Pennsylvania | 53.26 | 22 | 30 | High school graduation rate: 86.1% (21st highest) Public school spending: $15,291 per pupil (9th highest) 8th grade NAEP proficiency: 36.0% (math) 39.1% (reading) Adults with at least a bachelor’s degree: 30.8% (22nd highest) Adults 25-64 with incomes at or above national median: 53.2% (18th highest) |
| 25 | South Dakota | 52.83 | 13 | 46 | High school graduation rate: 83.9% (23rd lowest) Public school spending: $11,133 per pupil (19th lowest) 8th grade NAEP proficiency: 33.7% (math) 34.4% (reading) Adults with at least a bachelor’s degree: 28.9% (22nd lowest) Adults 25-64 with incomes at or above national median: 50.7% (25th lowest) |
| 26 | Montana | 52.39 | 21 | 42 | High school graduation rate: 85.6% (24th highest) Public school spending: $13,849 per pupil (15th highest) 8th grade NAEP proficiency: 38.9% (math) 36.9% (reading) Adults with at least a bachelor’s degree: 31.0% (20th highest) Adults 25-64 with incomes at or above national median: 46.0% (11th lowest) |
| 27 | Rhode Island | 51.98 | 29 | 11 | High school graduation rate: 82.8% (20th lowest) Public school spending: $15,002 per pupil (10th highest) 8th grade NAEP proficiency: 32.0% (math) 34.8% (reading) Adults with at least a bachelor’s degree: 34.1% (12th highest) Adults 25-64 with incomes at or above national median: 56.4% (11th highest) |
| 28 | Texas | 51.79 | 30 | 13 | High school graduation rate: 89.1% (5th highest) Public school spending: $8,485 per pupil (4th lowest) 8th grade NAEP proficiency: 32.3% (math) 28.0% (reading) Adults with at least a bachelor’s degree: 28.9% (22nd lowest) Adults 25-64 with incomes at or above national median: 49.3% (22nd lowest) |
| 29 | Kansas | 51.56 | 27 | 25 | High school graduation rate: 85.7% (23rd highest) Public school spending: $11,761 per pupil (25th lowest) 8th grade NAEP proficiency: 33.2% (math) 34.8% (reading) Adults with at least a bachelor’s degree: 32.8% (15th highest) Adults 25-64 with incomes at or above national median: 51.2% (24th highest) |
| 30 | North Carolina | 51.00 | 28 | 21 | High school graduation rate: 85.9% (22nd highest) Public school spending: $9,217 per pupil (6th lowest) 8th grade NAEP proficiency: 32.6% (math) 30.4% (reading) Adults with at least a bachelor’s degree: 30.4% (24th highest) Adults 25-64 with incomes at or above national median: 46.2% (12th lowest) |
| 31 | Hawaii | 48.22 | 36 | 26 | High school graduation rate: 82.7% (19th lowest) Public school spending: $13,436 per pupil (16th highest) 8th grade NAEP proficiency: 30.0% (math) 25.7% (reading) Adults with at least a bachelor’s degree: 31.9% (18th highest) Adults 25-64 with incomes at or above national median: 53.9% (14th highest) |
| 32 | Ohio | 48.01 | 33 | 39 | High school graduation rate: 83.5% (22nd lowest) Public school spending: $12,543 per pupil (23rd highest) 8th grade NAEP proficiency: 35.4% (math) 35.5% (reading) Adults with at least a bachelor’s degree: 27.5% (14th lowest) Adults 25-64 with incomes at or above national median: 50.4% (24th lowest) |
| 33 | Michigan | 47.50 | 34 | 38 | High school graduation rate: 79.7% (11th lowest) Public school spending: $12,765 per pupil (21st highest) 8th grade NAEP proficiency: 28.5% (math) 31.8% (reading) Adults with at least a bachelor’s degree: 28.3% (16th lowest) Adults 25-64 with incomes at or above national median: 49.6% (23rd lowest) |
| 34 | Georgia | 47.45 | 37 | 36 | High school graduation rate: 79.4% (7th lowest) Public school spending: $9,742 per pupil (12th lowest) 8th grade NAEP proficiency: 28.4% (math) 30.2% (reading) Adults with at least a bachelor’s degree: 30.5% (23rd highest) Adults 25-64 with incomes at or above national median: 48.6% (19th lowest) |
| 35 | Tennessee | 47.11 | 31 | 45 | High school graduation rate: 88.5% (8th highest) Public school spending: $9,605 per pupil (9th lowest) 8th grade NAEP proficiency: 29.2% (math) 32.8% (reading) Adults with at least a bachelor’s degree: 26.1% (10th lowest) Adults 25-64 with incomes at or above national median: 45.4% (9th lowest) |
| 36 | Missouri | 46.72 | 32 | 48 | High school graduation rate: 89.0% (6th highest) Public school spending: $11,558 per pupil (23rd lowest) 8th grade NAEP proficiency: 31.4% (math) 36.3% (reading) Adults with at least a bachelor’s degree: 28.5% (18th lowest) Adults 25-64 with incomes at or above national median: 48.5% (18th lowest) |
| 37 | California | 45.93 | 38 | 32 | High school graduation rate: 83.0% (21st lowest) Public school spending: $9,417 per pupil (8th lowest) 8th grade NAEP proficiency: 27.1% (math) 28.4% (reading) Adults with at least a bachelor’s degree: 32.9% (14th highest) Adults 25-64 with incomes at or above national median: 51.7% (21st highest) |
| 38 | Idaho | 45.02 | 35 | 50 | High school graduation rate: 79.7% (11th lowest) Public school spending: $8,422 per pupil (3rd lowest) 8th grade NAEP proficiency: 34.0% (math) 37.2% (reading) Adults with at least a bachelor’s degree: 27.6% (15th lowest) Adults 25-64 with incomes at or above national median: 45.0% (8th lowest) |
| 39 | West Virginia | 43.54 | 45 | 7 | High school graduation rate: 89.8% (3rd highest) Public school spending: $12,993 per pupil (20th highest) 8th grade NAEP proficiency: 20.5% (math) 27.2% (reading) Adults with at least a bachelor’s degree: 20.8% (the lowest) Adults 25-64 with incomes at or above national median: 43.8% (5th lowest) |
| 40 | Oregon | 43.24 | 40 | 37 | High school graduation rate: 74.8% (3rd lowest) Public school spending: $11,515 per pupil (22nd lowest) 8th grade NAEP proficiency: 33.7% (math) 35.7% (reading) Adults with at least a bachelor’s degree: 32.7% (16th highest) Adults 25-64 with incomes at or above national median: 48.9% (20th lowest) |
| 41 | District of Columbia | 42.38 | 41 | 44 | |
| 42 | Arkansas | 41.76 | 39 | 51 | High school graduation rate: 87.0% (17th highest) Public school spending: $11,758 per pupil (24th lowest) 8th grade NAEP proficiency: 24.9% (math) 26.8% (reading) Adults with at least a bachelor’s degree: 22.4% (3rd lowest) Adults 25-64 with incomes at or above national median: 42.2% (2nd lowest) |
| 43 | South Carolina | 41.44 | 42 | 41 | High school graduation rate: 82.6% (18th lowest) Public school spending: $11,178 per pupil (20th lowest) 8th grade NAEP proficiency: 25.7% (math) 27.8% (reading) Adults with at least a bachelor’s degree: 27.2% (13th lowest) Adults 25-64 with incomes at or above national median: 44.3% (6th lowest) |
| 44 | Alabama | 41.21 | 46 | 17 | High school graduation rate: 87.1% (16th highest) Public school spending: $10,142 per pupil (14th lowest) 8th grade NAEP proficiency: 17.2% (math) 25.6% (reading) Adults with at least a bachelor’s degree: 24.7% (7th lowest) Adults 25-64 with incomes at or above national median: 46.3% (13th lowest) |
| 45 | Nevada | 41.02 | 44 | 40 | High school graduation rate: 73.6% (2nd lowest) Public school spending: $8,801 per pupil (5th lowest) 8th grade NAEP proficiency: 26.1% (math) 27.4% (reading) Adults with at least a bachelor’s degree: 23.5% (6th lowest) Adults 25-64 with incomes at or above national median: 44.6% (7th lowest) |
| 46 | Mississippi | 40.94 | 43 | 43 | High school graduation rate: 82.3% (17th lowest) Public school spending: $9,885 per pupil (13th lowest) 8th grade NAEP proficiency: 21.8% (math) 20.0% (reading) Adults with at least a bachelor’s degree: 21.8% (2nd lowest) Adults 25-64 with incomes at or above national median: 41.4% (the lowest) |
| 47 | Oklahoma | 38.74 | 48 | 20 | High school graduation rate: 81.6% (15th lowest) Public school spending: $9,227 per pupil (7th lowest) 8th grade NAEP proficiency: 22.9% (math) 29.4% (reading) Adults with at least a bachelor’s degree: 25.2% (8th lowest) Adults 25-64 with incomes at or above national median: 46.0% (11th lowest) |
| 48 | Alaska | 38.60 | 47 | 23 | High school graduation rate: 76.1% (4th lowest) Public school spending: $20,640 per pupil (2nd highest) 8th grade NAEP proficiency: 31.8% (math) 31.4% (reading) Adults with at least a bachelor’s degree: 29.6% (25th lowest) Adults 25-64 with incomes at or above national median: 59.6% (5th highest) |
| 49 | Arizona | 36.84 | 50 | 31 | High school graduation rate: 79.5% (8th lowest) Public school spending: $8,131 per pupil (2nd lowest) 8th grade NAEP proficiency: 34.8% (math) 31.1% (reading) Adults with at least a bachelor’s degree: 28.9% (22nd lowest) Adults 25-64 with incomes at or above national median: 47.7% (16th lowest |
| 50 | Louisiana | 34.65 | 49 | 47 | High school graduation rate: 78.6% (5th lowest) Public school spending: $12,153 per pupil (25th highest) 8th grade NAEP proficiency: 17.9% (math) 23.3% (reading) Adults with at least a bachelor’s degree: 23.4% (5th lowest) Adults 25-64 with incomes at or above national median: 46.5% (14th lowest) |
| 51 | New Mexico | 27.61 | 51 | 49 | High school graduation rate: 71.0% (the lowest) Public school spending: $10,768 per pupil (17th lowest) 8th grade NAEP proficiency: 20.6% (math) 20.1% (reading) Adults with at least a bachelor’s degree: 27.2% (13th lowest) Adults 25-64 with incomes at or above national median: 43.2% (4th lowest) |